Monitor Your Application Metrics Using Openshift’s Monitoring Stack
As we keep on pushing towards A microservices development approach and decouple our applications into smaller components that communicate with each other, it becomes harder to monitor each one of the components by itself.
If we were used to having a server that runs an agent and takes care of collecting data and shipping it to our organizational monitoring solution, In the Kubernetes world (which has become the de-facto standard for microservices applications) things get a bit messy.
As Kubernetes has a wide ecosystem of complementary solutions, most of them are DIY (Do it yourself), and sometimes we find ourselves “reinventing the wheel”.
In this article, I’d like to share with you how Openshift can help you monitor your own written Application, which means that besides monitoring infrastructure resources (which happens in Openshift by default using an out-of-the-box Prometheus, Thanos, Grafana and AlertManager stack), you could monitor your Application metrics using the same stack, to get a better understanding of how it behaves.
Let’s get started!
Prerequisites
- Openshift 4.10 cluster
As you can see, the only prerequisite is having an installed Openshift 4.10 cluster, as the rest is part of Openshift's default Installation.
A Bit Of Theory
To demonstrate how you can build your application so it could be monitored by Openshift, we'll start with the theory first.
In this demo, we’ll write an example application using Flask that exposes application metrics using an implemented REST API.
Our application will be exposing the following metrics:
concurrent_requestspending_requestsuptimehealth
For the sake of this demo, we’ll use randomized data that will eventually refresh every time our Flask server gets a GET request.
In addition, we’ll write a Prometheus exporter, that will fetch those metrics from our Flask server and wait for Prometheus to scrape them on a pre-defined interval.
Building Our Application, Including The Exporter
Assuming that our application is not synced, and each Flask server gets its own connections (without replicating it with other application servers) - we'll have to bundle our application and its exporter on the same Kubernetes pod.
Let’s start with looking at the application’s code:
As you can see, whenever a GET request reaches our Flask server under the /status route, those four metrics that we've mentioned before will be returned in a JSON data structure.
Now that we have a better understanding of how the applications works, let’s take a look at the exporter code:
As you can see, our exporter gets the right URL to connect to our application and performs a GET request to the /status route.
The exporter acts as a web server itself and exposes those metrics converted into a Prometheus structure under a pre-defined port (9877), so that they'll be able to be scraped by Prometheus.
Now, let’s build those two components into container images, so we'll be able to run them both on our Openshift cluster.
Building Our Web App (Optional)
You don’t have to perform this part, but if you plan on changing the code or the metrics, it’s better that you use the following methods.
Change the directory to where files are located, build your app, and push it to your registry:
$ cd webapp$ buildah bud -t flask-app .$ podman tag localhost/flask-app:latest shonpaz123/webapp-exporter:webapp$ podman push shonpaz123/webapp-exporter:webapp
Building Our Exporter (Optional)
Let’s do the same with our exporter app:
$ cd exporter$ buildah bud -t app-exporter .$ podman tag localhost/app-exporter:latest shonpaz123/webapp-exporter:exporter$ podman push shonpaz123/webapp-exporter:exporter
Great, now make sure that you have the Kubernetes context to your Openshift cluster, create a project, and deploy those two containers into a single Kubernetes pod.
$ oc new-project mywebapp-monitoringTo take a look at the deployment:
Now deploy those to your Openshift cluster:
$ oc apply -f 01-deploy-webapp.yamlMake sure that your pod is running, and that it has two containers:
$ oc get pods NAME                                                  READY   STATUS    RESTARTS      AGE
webapp-779965cdcd-mlbjz                               2/2     Running   0 (46m ago)   5h3m
Now, we’ll create a service that points to our pod in the exporter port, so that our central Prometheus instance could reach our and scrape metrics:
$ oc apply -f 02-exporter-service.yamlIn case you want to verify that your exporter collects data from the application, create a Route and access it through your browser (refresh the page to see if data changes):
$ oc apply -f 03-exporter-route.yamlTelling Prometheus Where To Scrape
In Openshift, if we want to central Prometheus to scrape metrics from a specific target, we can create a ServiceMonitor object, that will tell Prometheus how it should access the exporter service.
As the Openshift's central Prometheus instance is immutable, we'll have to enable user workload monitoring, which will deploy an additional Prometheus instance that will scrape our exporter.
Don’t worry! both Prometheus instances are being queried by the same central Thanos Querier.
Make sure to enable the user workload monitoring by creating the following config map:
$ oc apply -f 00-enable-user-workload.yamlLet’s look at our ServiceMonitor object:
As you can see, the ServiceMonitor looks for a specific label under a specific namespace, that suits our exporter service definition.
Let’s create it:
$ oc apply -f 04-service-monitor.yamlNow, make sure that you see it in your Openshift Console, by navigating to Observe --> Targets:

As you can see, its status is ip, and it points to our pod using the exporter service that we have provided.
Querying App Data Using The Openshift Console
Now, make sure you navigate to Observe --> Metrics, and put one of our metrics in the query expression, for example app_uptime:

Great! we see our generated data as part of the Openshift console.
Using Alerts Using The Openshift Console
Let’s create an alert, that will notify us under the Alerting tab in the Openshift Console whenever our application is identified as not healthy:
We expect to see this alert showing in our Openshift Console after creating the following resource:
$ oc apply -f 05-prometheus-rule.yamlNow let’s verify that our alert is showing up:

To get a more detailed understanding of how many times this alert was notified:

Visualizing Custom Metrics Using Grafana
Now that we have Prometheus querying our application data properly using the created ServiceMonitor, we can deploy our own Grafana instance as part of our project, that will query the central Thanos Querier.
This will allow us to visualize our metrics in our own Grafana.
Deploying Our Grafana Instance Using An Operator
To do so, let’s install the Grafana operator using the Operator Hub:

Now, we’ll create a Grafana instance:
Make sure that your Grafana pods are in a running state:
$ oc get pods NAME                                                  READY   STATUS    RESTARTS      AGE
grafana-deployment-5b758875b6-rv8dn                   1/1     Running   0             5h31m
grafana-operator-controller-manager-bcd5d6889-d7855   2/2     Running   0             5h34m
Pointing Our Grafana Instance To The Central Thanos Querier
In order for our Grafana to be able to query metrics from our central Thanos Querier, we should grant the Grafana service account the abillity to use the suitable resources (view permissions):
$ oc adm policy add-cluster-role-to-user cluster-monitoring-view -z grafana-serviceaccountNow, let’s fetch the service account’s token, and create our Prometheus data source for Grafana:
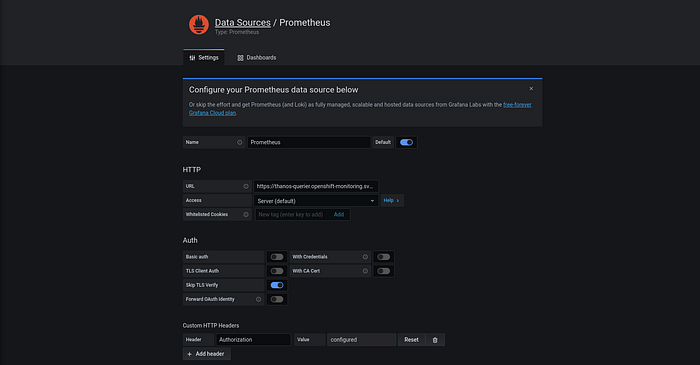
$ oc serviceaccounts get-token grafana-serviceaccountCreate your data source, and make sure to replace it with your service account’s token:
After editing your token, create the wanted resource:
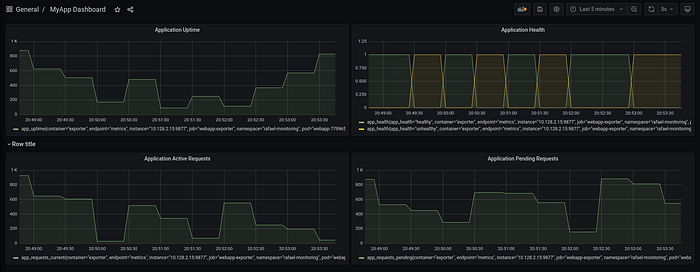
$ oc apply -f 07-create-prometheus-datasource.yamlNow log in to your Grafana using the created Route, and this is what you should expect:

In order to visualize metrics, import the dashboard.json file located in the git repository, and visualize your application's metrics:

Congrats! our metrics can be visualized!
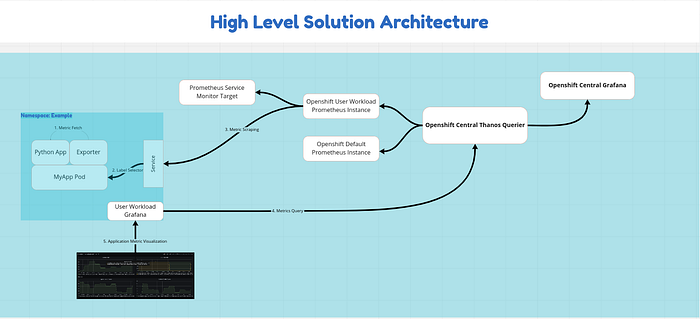
The High-Level Solution
As we have reached the final stage of this demo, it’s important that you’ll understand how our solution is built.
Make sure that you understand the following diagram before moving with your life:

Conclusion
We saw how we can use Openshift's goodies in order to have a managed solution for both infrastructure and application metrics, this brings great value to you as PaaS admins and of course to your own customers.
Hope you’ve enjoyed this demo, See ya next time :)
